SFlow, NetFlow, and a beavy of other kinds of flows all coming out with every new router.
You are here
How To Monitor Network Traffic
Monitoring network traffic is an incredibly powerful way to understand issues or problems within your IT environment. For many businesses, network performance is critical and if it’s failing or at its limit, there will be adverse effects that can cost time, money and resources.
In order to understand, prevent and resolve these issues, there are numerous methods available to you for your network traffic monitor. Most importantly, the first thing you should focus on is “what do you want to achieve?”. Are you looking to better understand a specific issue? Perhaps it is more of an overall theme such as improving your awareness of what is crossing your network. Whatever the reason may be, having a predefined goal in place before you set out is essential.
Troubleshooting and diagnostic use
Exploring the depths of your network environment is a great way to troubleshoot problems and diagnose pain points in your environment. In order to do this properly, you are going to want as much available data as possible. Based off our own experience, I would recommend looking at TCPDUMP, a command-line packet analyzer capable of displaying and storing the traffic sent or received on a network interface in full detail. TCPDUMP is a brilliant tool, but it may be a bit unwieldy for those not completely aware of what they are looking for.
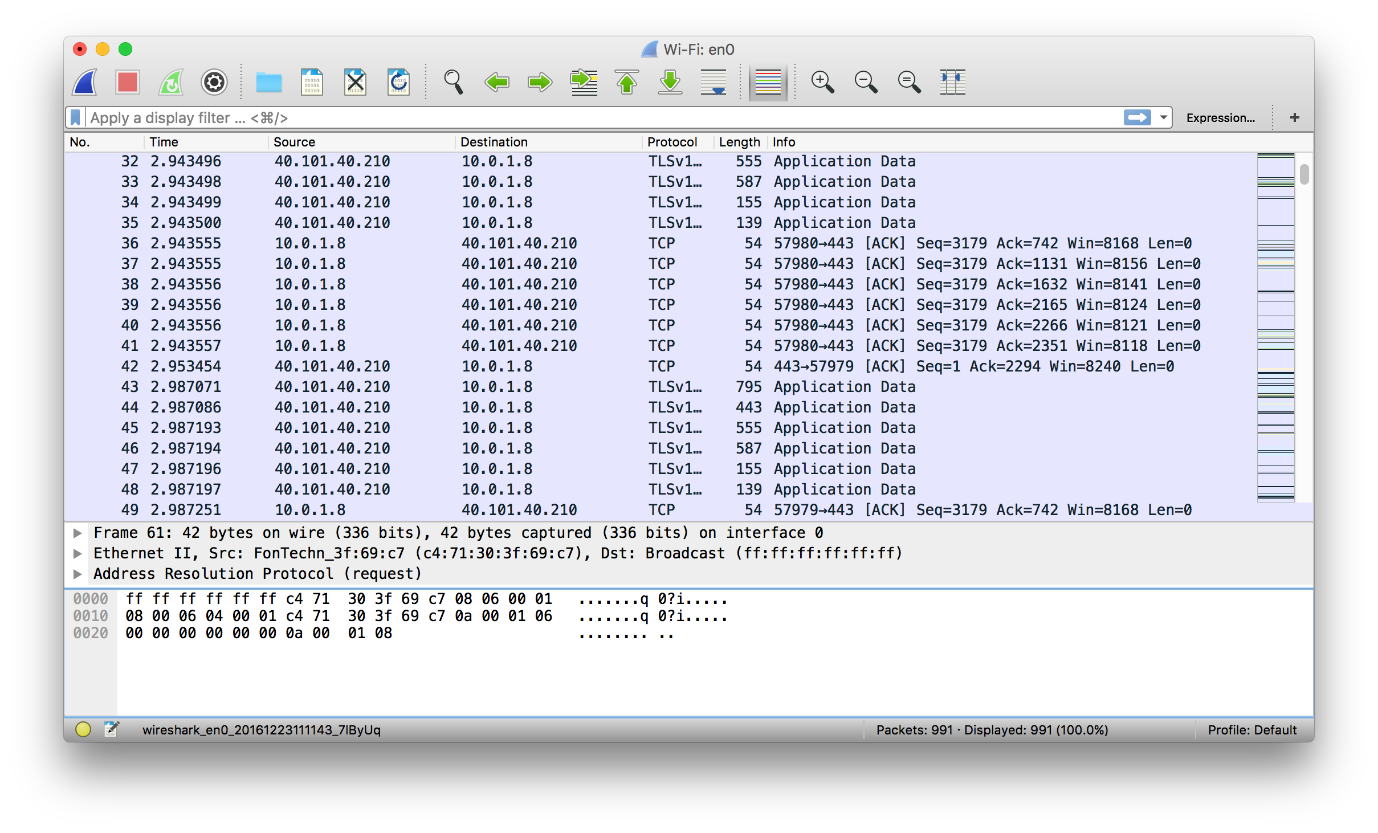
As an alternative, it may be more suitable to look at graphical tools such as Wireshark, as this often provides a more workable tool-set for looking at larger volumes of traffic. Wireshark also provides filter building tools that can be an invaluable time saver by preventing the need to manually mine through man pages.

Wireshark capturing wireless traffic
Port mirroring
It’s important to note that if you want to use tools such as TCPDUMP and Wireshark to look at traffic which does not involve the host you are monitoring from, you will need to consider configuring port mirroring or purchasing specific hardware to work as an inline tap. Port mirroring is supported on most managed switches as it has been a feature for the last 10 years. This can sometimes generate large volumes of traffic and that can be a substantial overhead to process. Mirroring a busy port can be like trying to take a drink from a fire hose when it comes to the volume of information provided. This is where the capture filters discussed earlier become invaluable. They allow you to sort the hundreds of thousands of packets you could be looking at over the course of a minute before you see or even process them.

Too much data can be a lot like drinking from a firehose
Network traffic monitor for statistical or analytical usage
For pattern analysis, trends and data flows, another option is to look at a sample of traffic or just the headers; this is where Netflow or sFlow/jFlow come into play.
Many managed switches give you the ability to export flows without needing a direct connection, allowing you to deploy a single collector to capture the flows. The great benefit of this is that it provides a clear view into every ‘flow’ on your network. Simply put, you can see the Who, How, Where and When of a transaction in your network, but not the actual payload data (so less actual resources are consumed when looking at the traffic).
This type of data is handled and processed by tools such as the command line tool NFDUMP, which will provide information (seen below) from the flows:

NFDUMP looking at two small flows taken from a NetFlow collector
Data like the above is extremely useful when it comes to consolidating and understanding the traffic passing through your network. The most useful elements (ex. the analytical tools) enable you to dive further into the data, such as the provision of a statistical view of traffic crossing your network. For example, Opsview Monitor’s Network Analyzer can be used to highlight the highest bandwidth consumers over a set period of time and lets you keep track of the traffic while managing its retention. This can all be presented in dynamic dashboards that allow you to keep a clean overview of what is going on in your network.
If you want to know more about how to network traffic monitor with Opsview, have a look at this video:
Summary
In conclusion, there are many ways to monitor traffic on your network connectivity if you know what you are looking to achieve, whether it’s looking for a specific issue or just trying to have a better understanding of WAN bandwidth utilization. There are many options that will give you much more visibility than you would expect and with the right tools, the extra level of insight becomes invaluable.
Let our team show you what Opsview Cloud can do for your company
Packet loss is the failure of one or more transmitted packets to arrive at their destination. Find out how you can fix it.
SNMPv3 traps can be quite complicated to configure the first time you go through the process, but when you understand what's going on, everything...


