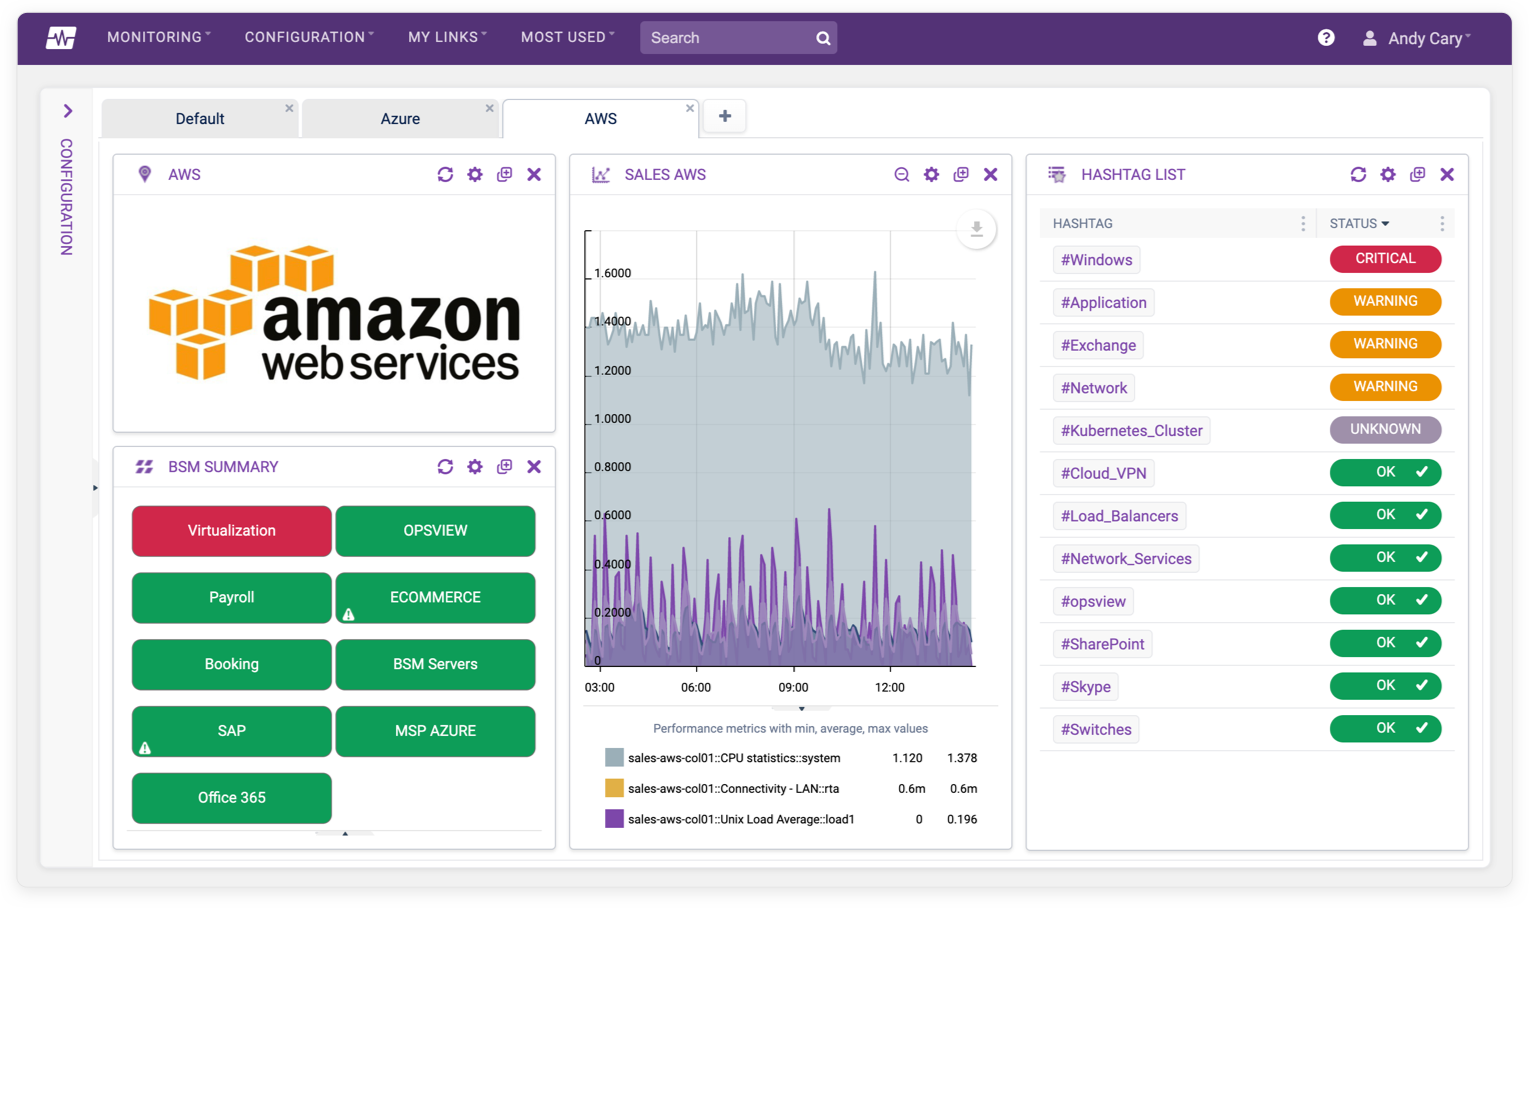
The Graph Center allows you to have a visual representation of the output of Service Checks as long as they contain numerical performance data ('perfdata'). This data can then be drawn within the 'Investigate mode' window of the Service Check as well as on the Graph Center.

A Unified View
- Quickly and easily group graphs for specific hosts, host groups, service checks, hashtags, or Business Service Monitoring elements on single pages.
- Create the views you need to gain insight quickly and act to mitigate issues.
Automated Viewing
- Graphs displayed within the 'view section' are automatically resized depending on how many graphs you want to view at the same time.
- By providing a clean viewing experience, you are able to quickly access the information you need and customize the specific metrics you want to view at any time.


Easy Navigation
- Within the navigation section of the Graph Center, you can easily configure, save, and share graphs.
- Your entire team can see what’s happening within your infrastructure and save time that can be used to increase value to the business.
